
Developing a National Groundwater Level Dataset for New Zealand#
Patrick Durney 1*, Evelyn Charlesworth 1, and Matt Dumont 1
1 Komanawa Solutions Ltd, Christchurch, New Zealand * Corresponding author
Abstract#
Groundwater level data is a fundamental dataset for water resource and shallow water table hazard investigation, but the data are often held in a fragmented and diverse array of databases across New Zealand. Here we describe a national New Zealand dataset of depth to water and groundwater elevation data. This dataset is available on request from the corresponding author. We have provided a pathway for future updates and for users to identify and flag issues with the dataset. We hope this dataset can save future researchers time and effort in collecting and processing groundwater level data and can be used for a range of applied science and research activities.
Introduction and Background#
Groundwater level data are a key input for a broad range of water resource investigation, management and research activities (e.g., testing global models, Reinecke et al., 2020; state of environment reporting, WMO, 2022). However, access to national groundwater level data in New Zealand is challenging because they are held in various Regional Council and Unitary Authority databases and in the New Zealand Geotechnical Database under a wide array of data architectures. Despite the National Environmental Monitoring Standards (Baddock, 2019), the quality of the data and associated metadata varies significantly; in some instances, the data are subject to rigorous quality assurance processes and include accurate measurement point elevations and spatial coordinates. In other instances, the data comprise single readings of unknown quality with no information on the measurement point elevation or even the depth of the well. These issues with groundwater, and environmental data more generally, are well known (Parliamentary Commissioner for the Environment, 2019). While some standardised datasets are maintained (e.g., the National Groundwater Monitoring Programme; GNS, 2022), they do not cover the full breadth of groundwater monitoring data and often have a specific focus, i.e., national state of the environment reporting or shallow geotechnical investigations.
This technical note outlines the data collected and the methods used to produce and analyse a national groundwater level/depth to water dataset for New Zealand for the Future Coasts Aotearoa research programme. Future Coasts Aotearoa is a National Institute of Water and Atmospheric Research-led Ministry of Business, Innovation and Employment Endeavour research programme (contract C01X2107). The programme combines expertise in Indigenous culture, economics, social, and physical sciences to tackle the issue of sea-level rise in coastal lowland communities by enhancing the evidence base for sea-level rise risks. Key groundwater science outputs include developing impact and adaptation thresholds for shallow groundwater hazards, producing a national coastal groundwater hazard exposure assessment, and creating national and local models of seawater intrusion and water table shoaling (NIWA, 2022). The dataset developed for this research covers all readily accessible public domain groundwater level data and will likely also be valuable for a range of other applied science and research activities.
Methodology#
Data gathering scope#
Groundwater level data can be grouped into discrete measurements and regular/continuous monitoring. The former includes discrete values recorded during or immediately after well drilling, measurements taken during geotechnical investigations (e.g., Cone Penetration Tests, geotechnical bores and trial pits) and piezometric surveys undertaken by Regional Councils. The latter includes manual and instrument-based (recorder) regular data collection programmes undertaken by Regional Councils, Unitary Authorities and some Territorial Authorities. Additional groundwater readings are taken to meet consent conditions for certain activities. However, these data are often stored in reports and spreadsheets as large file sets. These are kept in records management systems run by Regional Council and Unitary Authority consenting and compliance teams. As a result, accessing these data requires significant resources. Our data collection was therefore constrained to discrete readings and regular monitoring data within Regional Council and Unitary Authority groundwater level databases and the New Zealand Geotechnical Database.
Data Request#
Data requests were sent out to 16 New Zealand councils in March 2023; this included all 11 regional councils and five unitary authorities. A further data request was sent out to all of the Territorial Authorities. While we received responses from multiple sources, only Tauranga City Council (TCC) provided new data beyond what we already had. Most respondents recommended we contact the Regional Council in their area for further information. The data request sought all historical groundwater level data; this included sites additional to any State of the Environment and National Groundwater Monitoring Programme monitoring sites, as well as any discrete readings. The aim was to collect as much national data as possible, including sites with a single reading. We were open to receiving both groundwater depth and/or groundwater level/elevation (GWL) data, on the proviso that it was specified to reduce data processing error. We also requested standard metadata for each site, with a minimum metadata requirement of:
Unique site identifier (e.g. site number)
Grid reference in NZTM
Well depth
Our preferred metadata requirements included:
Screen top & bottom depth (or casing depth where applicable)
Surveyed elevation of the ground surface at the measuring point
The distance between the measuring point and the general ground surface.
The data were received in Excel and csv formats, with various degrees of completeness and processing. Data management and storage varied from council to council, hence processing to standardise the data was required.
Alongside the direct requests to regional councils and unitary authorities, data was also pulled from Tethys (Kittridge, 2023), which allows Hilltop based data to be accessed and downloaded. For councils that had relevant and up-to-date data in Hilltop (Hills Labs, 2024), it meant we did not have to rely on a response to the direct request, and saved time in the data collection and processing.
A brief summary of the data collected from each council is provided in Table 1.
Table 1 Data collected by source
Council |
Data Provided |
|---|---|
Auckland Council (ARC) |
Continuous monitoring data downloaded from online data portal. Discrete data sent through in spreadsheets, including historical/closed sites. Metadata sent through in a separate spreadsheet. |
Bay of Plenty Regional Council (BOPRC) |
Continuous monitoring data and discrete groundwater levels sent through in separate spreadsheets. Metadata sent through in two different spreadsheets |
Environment Canterbury (ECAN) |
Continuous and discrete groundwater levels sent through in spreadsheets. Metadata sent through in a separate spreadsheet, with supporting supplementary information. |
Gisborne District Council (GDC) |
Available groundwater level data downloaded from Tethys. Separate data sent through from council, including discrete groundwater levels and other data classified by the council as poor quality. |
Hawkes Bay Regional Council (HBRC) |
Available groundwater level data downloaded from Tethys. Discrete groundwater levels, any sites missing from Tethys and extra metadata sent through from the council. |
Horizons Regional Council (HRC) |
Available groundwater level data downloaded from Tethys. Discrete groundwater levels sent through by council, as well as metadata for the sites sent through. Any sites missing from Tethys were also provided. |
Marlborough District Council (MDC) |
Available groundwater level data downloaded from Tethys. Only data sent through from the council was in the form of a shapefile which contained discrete water level from drilling and some site metadata. |
Nelson City Council (NCC) |
Any spot readings were sent through by the council with metadata included. |
Northland Regional Council (NRC) |
Available groundwater level data downloaded from Tethys. Any discrete readings were sent through by the council with metadata included. |
Otago Regional Council (ORC) |
Continuous and discrete readings sent through in spreadsheets, along with metadata in separate spreadsheets. |
Environment Southland (ES) |
Available groundwater level data downloaded from Tethys. Discrete readings sent through by the council, as well as any extra metadata and comments on the sites. |
Taranaki Regional Council (TRC) |
Available groundwater level data downloaded from Tethys. Any missing sites sent through by the council, including both continuous and discrete data. Metadata also sent through. |
Tasman District Council (TDC) |
Available groundwater level data downloaded from Tethys. Any discrete readings were sent through by the council with metadata included. |
Tauranga City Council (TCC) |
Continuous readings sent through in spreadsheets, along with metadata in separate spreadsheets. |
Waikato Regional Council (WRC) |
All continuous groundwater level data sent through by the council, with a separate csv file for each site. Discrete readings for each site sent through, as well as metadata. |
Wellington Regional Council (GWRC) |
Available groundwater level data downloaded from Tethys. Discrete readings with metadata sent through by the council as a spreadsheet and shapefile |
West Coast Regional Council (WCRC) |
Continuous and discrete groundwater level data sent through by the council, as well as metadata. |
Other: NZ Geotechnical database (NZGD) |
Continuous and discrete groundwater levels data sent through by NZGD, as well as associated metadata. These data were requested directly from Tonkin & Taylor which maintains the NZGD. |
Data Processing#
The data was processed using Python. The scripts used to process the data are available on GitHub; these are open source, and we encourage others to use and adapt them for their own purposes, as well as flag any issues or areas of improvement.
The systematic approach to the data processing was as follows:
Ingestion and Preliminary Cleaning
Individual scripts were developed for each council to cater to the unique formats of the datasets provided.
GWL data, alongside metadata, were ingested from two primary sources: direct council submissions and the Tethys platform, accessed via a Python API call.
Preliminary cleaning involved standardising data formats, renaming columns for consistency, and excising superfluous columns.
Data Standardisation and Transformation
The data was processed to ensure the presence of both depth-to-water and elevation measurements. In instances where elevation data was absent, LiDAR data (Sourced from the LINZ Data Service and licensed for reuse under the CC BY 4.0 licence) was utilised to ascertain site elevation.
Anomalies such as negative values or readings beyond expected ranges were examined and rectified. Erroneous NaN values were also purged from the dataset.
All spatial data were transformed into the NZGD 2000 Transverse Mercator projection and NZVD2016 vertical datum.
The data was resampled to a consistent temporal resolution, ergo standardised to daily intervals.
The data was checked for any duplicates and these were removed.
Metadata Synthesis and Alignment
Metadata processing paralleled the data cleaning steps, with additional emphasis on ensuring alignment between site names in the metadata and the GWL data.
The metadata schema encapsulated a comprehensive array of fields, ranging from well names and depths to spatial coordinates and screening details.
Groundwater elevations were derived from ground elevation plus collar height (where available) minus depth to water, except for instances where councils provided elevations in NZVD2016.
Data Aggregation and Quality Assurance
The processed data from various sources were coalesced into a singular dataset. This aggregation involved strategic merging and deduplication, governed by predefined rules to ensure data integrity.
Quality control measures, including data and metadata checks, were instituted to uphold accuracy and reliability.
Storing and Accessing Processed Data
The processed GWL data and metadata were systematically stored in an HDF5 datastore, facilitating ease of access and analysis.
Provisions were made to recalculate and update the stored data as necessary, ensuring the database can remain current and reflective of the most recent submissions.
Assumptions and Usage Considerations
A fundamental assumption is that depth-to-groundwater measurements below the ground surface are positive, with negative readings indicative of artesian conditions. This necessitated sign adjustments and validation against council records.
In cases where well depth information was unavailable, wells were presumed shallow rather than being excluded from the dataset; however the well depth is still flagged as a NaN value.
Specific regional peculiarities, such as the assumed + 100 m offset for coastal groundwater elevations provided by the Otago Regional Council, were corrected to NZVD2016.
For wells where the maximum depth to water exceeded the reported well depth, an assumption was made that the well depth equalled the maximum depth to water plus an additional 3 metres.
Statistical Analysis of Water Table Variation#
As previously noted, this National Depth to Water Dataset was compiled to support the Future Coasts Aotearoa research programme, where it is used following additional processing to produce maps of steady-state depth to water (DTW) probability at a national scale. The ultimate goal is the identification of areas at risk of groundwater inundation under relative sea-level rise. As noted, the dataset is also available for other uses, and we encourage researchers to use the dataset for a wide range of applications. As an example of some of the utility of this dataset, we present some simple statistical analyses below to uncover any prominent traits and generally describe the data. The steps were:
Categorisation by Depth. The dataset was divided into three depth categories:
Category 1: Sites with depths less than 10 meters.
Category 2: Sites with depths between 10 and 30 meters.
Category 3: Sites with depths greater than 30 meters.
Sub-setting by Number of Readings:
Only sites with more than 30 readings were included. This threshold was chosen as a rule of thumb to ensure a reliable calculation of the standard deviation.
Statistical Calculations. For each site in the subset, the following statistical measures were computed:
Mean: The average depth to water.
Standard Deviation: A measure of the variation in water levels.
Minimum: The lowest recorded water level.
Maximum: The highest recorded water level.
Grouping by Mean DTW:
The categories were analysed prescribed with breakpoints of: 0.1, 0.5, 1, 1.5, 2, 3, 5, 10, 15, 20, 30, 50, 75, 100 metres (while these breakpoints are for illustrative purposes only, the shallower categories correspond with infrastructure and building foundations assessed in the Future Coasts Aotearoa research programme).
The data was further grouped by the mean DTW to analyse combined statistics across different groups. This grouping allows for a comparison of water level characteristics across sites with similar mean DTW values.
This structured approach to data analysis supports an overview of the DTW across various sites. By categorising, sub-setting, and computing key statistics, we can identify patterns and traits that are important for assessing groundwater inundation risks at a national scale.
Results and discussion#
Dataset access#
The final dataset is available on request via a Python package at Komanawa-Solutions-Ltd/komanawa-nz-depth-to-water, upon completion of the the the Future Coasts Aoteroa research programme the data will be publicly released. The package readme includes installation instructions, usage examples, metadata descriptions, and instructions for contributing and maintaining the dataset.
Description of Dataset#
The dataset comprises a comprehensive collection of groundwater monitoring sites, spanning a significant temporal range from as early as December 29, 1899, but is overwhelmingly composed of younger data. More than half of the sites and records are measured after the mid-late 2000s, as shown in figure 1. The cumulative number of sites and records shown by data source is available in the supplementary material and GitHub repository.
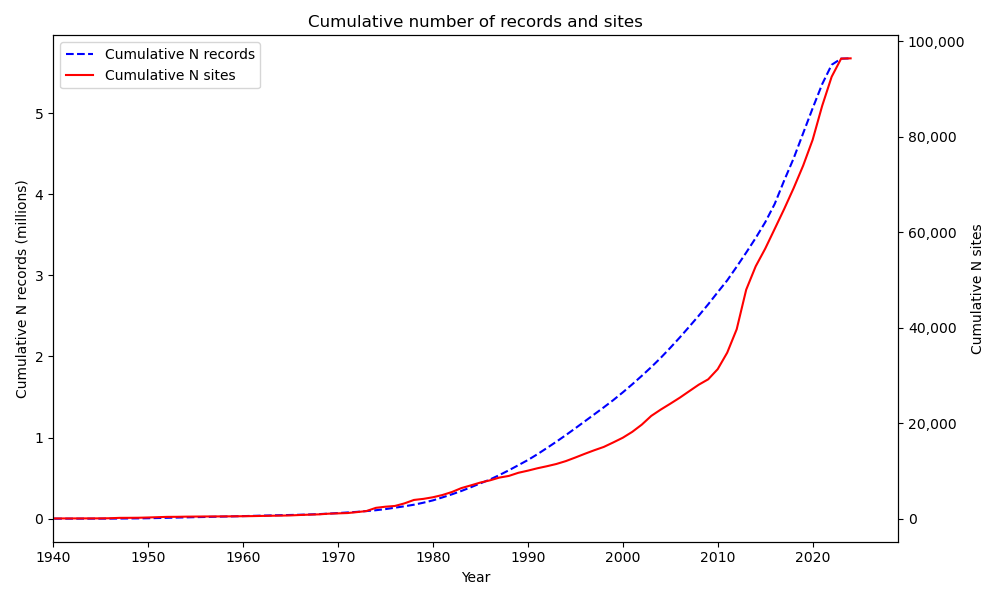
The growth in the number of sites and records over time (note sites without a valid date not included in plot)#
A statistical summary of the dataset is provided in Table 2.
Table 2 Overview of the dataset
Metric |
Value |
|---|---|
Number of sites |
113,526 |
Number of obs. |
5,691,851 |
Start date |
1899-12-29 |
End date |
2024-05-13 |
Mean n obs./site |
51.29 |
Number of sites with only one obs. |
94,110 |
Number of sites < 10 obs. |
102,282 |
Investigating the dataset by source reveals distinct patterns in data collection and density. Notably, Environment Canterbury (ECan) stands out with the highest number of observations. This contrasts the New Zealand Geotechnical Database (NZGD) which has many fewer observations per site (frequently <= 2 readings/site). Otago Regional Council (ORC) provided data for fewer monitoring sites, but with a high average reading count per site. These differences showcase the variability in both monitoring intensity and data abundance across different data providers. Collectively, these statistics underscore the heterogeneity of groundwater monitoring across regions, influenced by the varying goals (e.g. geotechnical investigations), methodologies, and resources. Further summary statistics of the data by the source are provided in Table 3.
Table 3 Data summary by source
Source |
N bores |
Start date |
End date |
N obs. |
Mean n obs./site |
N sites 1+ obs. |
|---|---|---|---|---|---|---|
ARC |
265 |
1970-03-16 |
2023-05-01 |
438,142 |
1,724.97 |
254 |
BOP |
4,485 |
1983-02-03 |
2023-10-09 |
132,636 |
30.00 |
27 |
ECAN |
13,885 |
1900-01-10 |
2023-04-20 |
2,334,351 |
169.01 |
8,113 |
GDC |
173 |
1973-03-07 |
2023-10-15 |
152,600 |
882.08 |
172 |
GWRC |
3,583 |
1955-02-06 |
2022-09-05 |
754,359 |
210.30 |
402 |
HBRC |
377 |
1972-11-22 |
2023-09-06 |
35,804 |
119.75 |
298 |
HRC |
4,410 |
1900-01-01 |
2023-08-17 |
98,213 |
24.37 |
2,570 |
MDC |
2,963 |
1908-04-01 |
2022-11-25 |
308,064 |
104.04 |
102 |
NCC |
12 |
2017-11-21 |
2024-04-30 |
648 |
54.00 |
12 |
NRC |
3,886 |
1903-03-04 |
2023-08-17 |
135,910 |
35.08 |
145 |
NZGD |
65,110 |
1899-12-29 |
2024-01-24 |
122,060 |
1.88 |
950 |
ORC |
110 |
1950-01-01 |
2023-12-04 |
99,304 |
1,034.42 |
60 |
SRC |
1,076 |
1980-09-09 |
2023-11-04 |
155,334 |
144.36 |
641 |
TCC |
96 |
2000-02-28 |
2024-05-13 |
235,278 |
2,450.81 |
96 |
TDC |
2,456 |
1900-01-01 |
2023-03-20 |
510,713 |
207.69 |
1,252 |
TRC |
2,365 |
1958-11-17 |
2023-12-04 |
45,427 |
75.46 |
286 |
WCRC |
216 |
1995-01-03 |
2024-01-09 |
2,716 |
12.52 |
29 |
WRC |
8,058 |
1979-05-25 |
2023-02-17 |
130,292 |
16.36 |
1,448 |
Uncertainties in the dataset#
As with any dataset, there are uncertainties in the data. The primary sources of uncertainty in this dataset are:
Measurement method variability: Different councils and organisations use different methods to measure groundwater levels, which can lead to variability in the data.
Data quality inconsistencies: The quality of data and associated metadata varies significantly across different sources. This includes:
Potential data entry errors from original sources
Varying quality of metadata provided with the data
Differences in measurement data quality (e.g., data collected by drillers immediately upon well completion versus as part of a regular monitoring programme)
LiDAR data resolution: The resolution of the LiDAR data used to estimate ground elevation can vary, potentially affecting the accuracy of the estimated groundwater elevation. While LiDAR provides a consistent baseline, its inherent uncertainties contribute to the overall uncertainty in depth to water calculations.
Temporal resolution variability: The frequency of measurements may differ across data sources, affecting the dataset’s ability to capture short-term fluctuations or seasonal patterns consistently across regions.
Data gaps: Some data may be missing, leading to gaps in the dataset. No interpolation was used to fill these gaps, preserving the original data integrity but potentially limiting coverage in some areas.
Measurement point accuracy: The accuracy of well locations and measurement point elevations can vary, contributing to uncertainties in the final depth to water calculations.
It is important to note that while consistent processing approaches were applied to moderate the dataset as much as possible, the original data quality from council sources could not be altered or corrected. The use of LiDAR data as a baseline for elevation helps to provide consistency, but users should be aware of these inherent uncertainties when applying the data to specific use cases.
Spatial Distribution#
To better describe the spatial extent of the dataset we have plotted the number of monitoring sites within 5 km of each monitoring site and the distance to the nearest groundwater monitoring site. Figures 2 and 3 show the results of these analyses. In addition, these figures and geotiffs of the data coverage are available in the supplementary material and the Github repository.
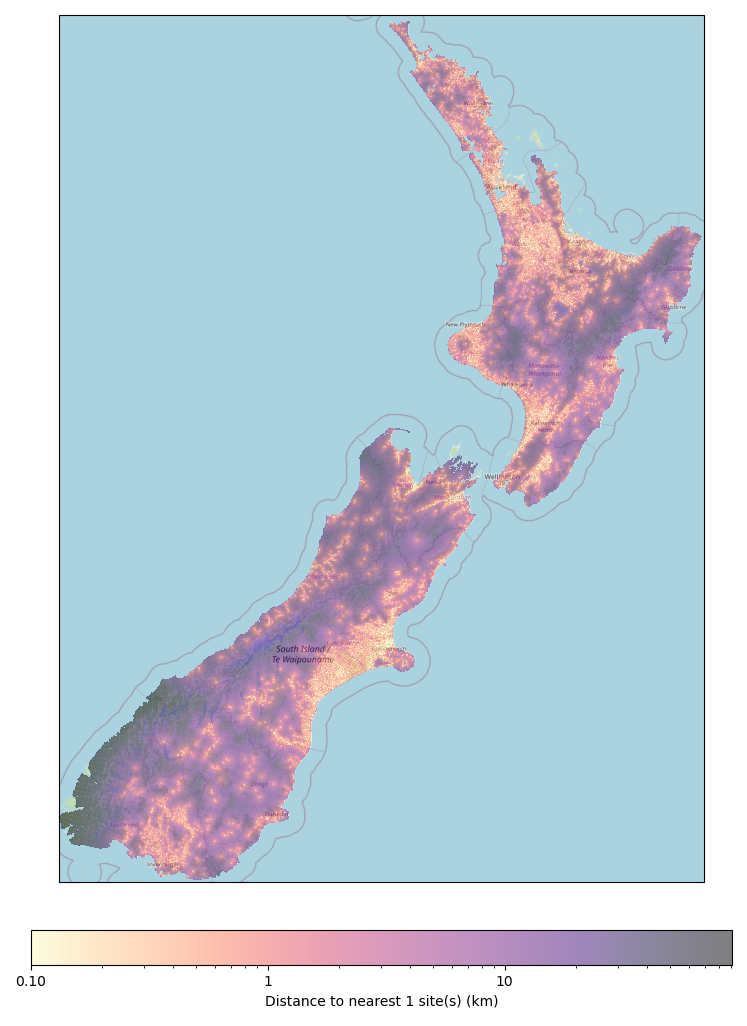
Distance to the nearest groundwater monitoring site#
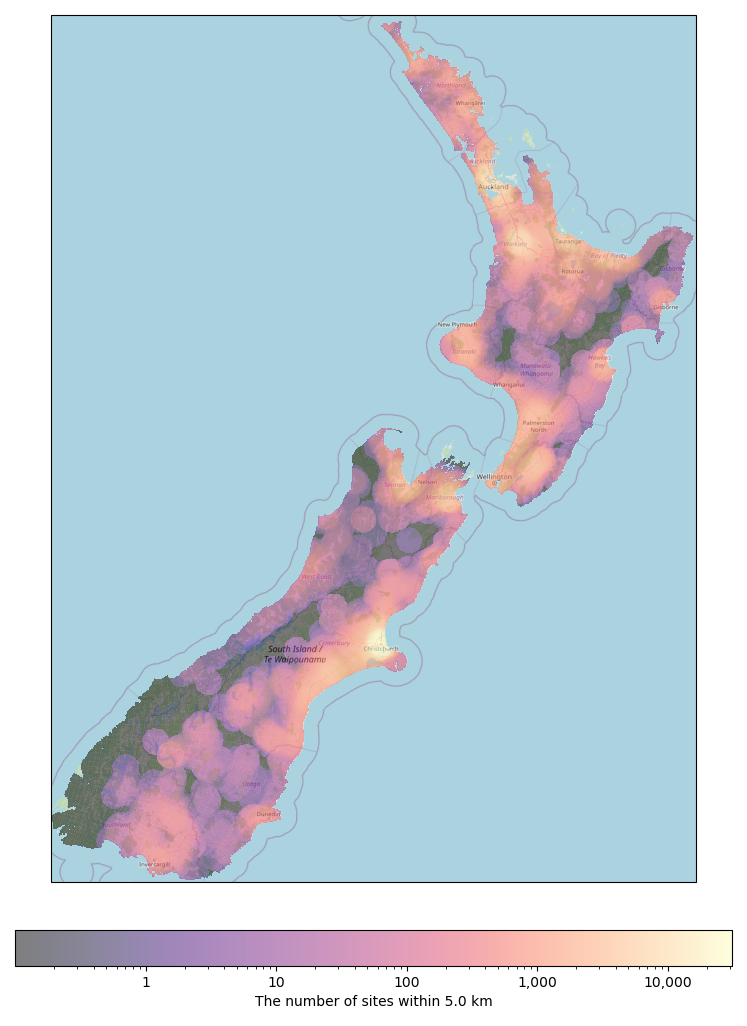
Number of monitoring sites within 5 km#
Potential Uses of the Dataset#
Beyond the original scope we see the dataset as having a wide range of potential uses, including but not limited to:
Consent applications and engineering design: Provides historical context across regions. Supports consistent decision-making for regulators and developers.
Model validation and research: Enables cross-regional studies and comparison. Improves national predictive models.
Climate change and hazard assessments: Allows analysis of long-term trends nationwide. Aids in identifying groundwater-related risks.
Resource management and policy development: Informs national water allocation policies. Supports evaluation of management strategies.
Data integration and analysis: Enables standardised data visualisation tools. Supports integration with other environmental datasets.
Statistical Description of Depth to Water Variance#
Overview depth to water variance statistics for shallow wells are provided below in line with the goals of the Future Coasts Aotearoa research programme. More detailed statistics for the broader dataset are provided in the supplementary material and available on the GitHub repository.
In depth category 1 (shallow wells, < 10m), the depth to water exhibits little variation in the shallower bins, suggesting proximity to boundary condition and/or high (unconfined) storage coefficients. As depth increases, the variability in the depth to water also increases, as evidenced by larger ranges and higher standard deviations. For instance, in depth category 1, the standard deviation median increases from 0.077 in the <0.1 m bin to 0.48 in the 5 to 10 m bin. Notably, the skewness suggests a tendency towards shallower water levels in many records, despite the large possible ranges in depth. This is observed in the negative skewness values that become more pronounced with increasing depth, indicating that while the average water levels are deeper, there are frequent instances of shallower depths. The kurtosis values further highlight the presence of notable outliers and extreme values. As depth increases, the kurtosis medians remain high or increase, indicating distributions with frequent extreme values. This pattern is consistent across other depth categories, where deeper bins show increased kurtosis, suggesting that extreme values become more apparent with depth. Overall, the statistics indicate that as depth increases, not only does the variability in water levels increase, but the presence of outliers and extreme values also becomes more pronounced. Finally, the statistics suggest the data is skewed and leptokurtic, meaning the data is not normally distributed and the mean and standard deviation are not necessarily representative of the data (refer Table 4).
Table 4 Summary of variance and skewness for well depth < 10m or unknown depth and max dtw < 10m
Conclusions#
Access to fundamental groundwater data is essential for understanding the dynamics of groundwater systems and their interactions with the environment. New Zealand’s current groundwater monitoring network is diverse and fragmented, with each provider having unique monitoring objectives, methodologies, and data storage and management systems. While some national approaches have been undertaken to standardise data collection and storage, these are not comprehensive and often have specific focuses. We are aware of efforts to create a national wells database, which would likely provide significant improvements in metadata quality and accessibility. However, at present, there is no intention to host actual water level data in this database. The current state of groundwater level data availability in New Zealand thus continues to provide a significant barrier to and inefficiency in understanding and adapting to the impacts of climate change and sea-level rise on groundwater systems. A comprehensive set of discrete and regular groundwater level readings and metadata was collated from Regional Councils, Unitary Authorities and the New Zealand Geotechnical Database and processed into a consistent format. The output of this work is a national depth to water and groundwater elevation dataset for New Zealand. The groundwater level data and metadata are available as a complete dataset which can be used to better understand shallow groundwater hazards in New Zealand and for a range of other applied science and research activities, such as well interference assessments, stormwater detention pond groundwater depth assessments and regional and national groundwater modelling. Although the database provides a comprehensive set of groundwater level data at the time of writing, the value of this database will decline over time as new data are collected. We recommend that a pragmatic set of standards be adopted for all data held by councils and other organisations that collect groundwater data. These standards should include the following:
All public data held by an organisation should be made available via a public API.
All public datasets should include metadata. Ideally this metadata would be in a standard machine readable format, but as an interim solution or for less frequently used data, a simple publicly visible document discussing the data structure and any peculiarities would be a good start.
All public datasets should have a mechanism for users to report errors or issues with the data and these issues should be publicly visible. Even if organisations do not have the resources to fix all these issues (e.g. wrong bore depth), there is value in collating them. At the moment each researcher must discover these issues themselves, which is challenging and time consuming. Consider the value of forums like Stack Exchange or GitHub issues for this purpose in the software development world.
All public datasets should have consistent +ve or -ve signs for depth to water above or below measuring point. Ideally this would be a national standard, but minimally should be an organisational standard and documented.
All public datasets should have a measured distance between the measuring point and the general surrounding ground surface.
All water level data collected for compliance with consent conditions should be submitted in an electronic form, and systems should be developed to accurately and effectively upload these data into council databases.
Additionally, we would like to commend the NZGD for their work in providing a national database of geotechnical data. The dataset was of enormous value to this project, particularly in data sparse regions; however our use case may have been beyond the expected purpose of the NZGD. Specifically, we often found significantly conflicting data points in close proximity. Based on our analysis, we suspect that these discrepancies likely stem from variations in the drilling locations, such as greenfield sites versus foundation pits. The NZGD could significantly improve their database for shallow groundwater hazard management by:
Included a field to specify whether measurements at a point are relative to the average surrounding land surface or taken in foundation excavations.
Include and possibly mandate the provision of GPS elevation data for the depth to water measuring point and/or a measured distance between the measuring point and the general surrounding ground surface (e.g. depth of foundation excavation).
As discussed above the NZGD would also benefit from:
A public API for data access.
A publicly visible mechanism for users to report issues, inconsistencies, and concerns with the data.
Finally we have some specific recommendations that could be undertaken to improve the dataset we have produced:
Further quality assurance of the data, including cross-referencing the finalised data with councils.
Further analysis of the data to identify any potential errors or outliers.
Updating the dataset with new data as it becomes available.
Contributing and issues/bugs#
We have made every attempt to ensure the quality of the data and code in this repository. However, inevitably, there will be issues with the data or code. If you find an issue, please raise it directly with us. Or following public release by raising an issue on the GitHub repository Komanawa-Solutions-Ltd/komanawa-nz-depth-to-water#issues. If you would like to contribute to the code or data, please fork the repository and submit a pull request. While we would like to commit to maintaining this dataset in the future, we are a small team and may not have the resources to do so. If you would like to become a longer term contributor to this dataset, please get in touch.
Limitations#
While we have made every attempt to ensure the quality of the data and code in this repository, we do not provide any explicit or implicit guarantee of the datasets produced or methods provided here. In addition, by proving the base data, the data providers have also not provided any explicit or implicit guarantee of these data. Data errors will inevitably exist in the dataset, and we encourage users to report these errors to us so that we can correct them.
We are aware of limitations of this work which are listed below:
We have made a series of assumptions during the data processing; these are discussed above.
The data is only as good as the data provided by the provider or sourced by Kо̄manawa; we did not have the resources nor all the information to fully quality-assure the data.
No data provider has provided any explicit or implicit guarantee of the data they have provided and cannot be held liable for any inaccuracies, errors, or omissions in the dataset.
For many sites, the elevation of the measuring point is unknown. We have used LiDAR data to estimate the elevation of the ground, but this will likely reduce the accuracy of the groundwater elevation depending on the resolution of the LiDAR data.
We have assumed that the depth to water from ground level is correct, and therefore any errors in the depth to water data will be reflected in the groundwater elevation values.
There may be unknown regional data handling/reporting peculiarities that we were not aware of that could affect the data.
The dataset is not exhaustive, and there may be more data available that has not been included in this dataset.
Additionally the dataset is a static snapshot of the available data as of September 2023. Datasets typically are updated and improved over time, and this dataset may not reflect the best available data at the time of use. We encourage users to check the original data sources for the most up-to-date information. Should differences be found between this dataset and data accessed more recently from the original sources, this dataset should be assumed to be incorrect. We encourage users to report these differences via the issues page on the GitHub repository. We make no guarantee to address these issues; however open issues will serve a purpose by informing other users of potential issues with the dataset.
Before using the data please ensure you fully understand these limitation, the limitations of the original data sources, and check for any potential issues raised by other users in the issues page of the GitHub repository.
Acknowledgements#
We would like to thank the New Zealand Ministry of Business, Innovation and Employment for funding this research through the project “Future Coasts Aotearoa”, managed by the National Institute of Water and Atmospheric Research (NIWA), contract C01X2107. This work could not have been completed without the support of the Regional Councils, Unitary Authorities, and other scientists who provided us with data and assistance. We would like to acknowledge the Regional Councils and Unitary Authorities, especially their environmental data teams, for providing us with the required data, and for responding to our data requests and subsequent questions. We would like to acknowledge the following people and organisations:
Freya Green from Auckland Council
Paul Scholes, Breda Savoldelli & Rochelle Gardner from Bay of Plenty Regional Council
Jennifer Tregurtha from Environment Canterbury
Julia Kendall from Gisborne District Council
Ale Cocimano from Hawkes Bay Regional Council
Michaela Rose from Horizons Regional Council
Charlotte Tomlinson from Marlborough District Council
Susie Osbaldiston & Sandrine Le Gars from Northland Regional Council
Marc Ettema from Otago Regional Council
Fiona Smith from Environment Southland
Sarah Avery from Taranaki Regional Council
Matt McLarin from Tasman District Council
Debbie Eastwood & Sung Soo Koh from Waikato Regional Council
Rob Van Der Raaij from Wellington Regional Council
Jonny Horrox from West Coast Regional Council
Simon Matthews from the New Zealand Geotechnical Database
Chris Strang from Nelson City Council
Mike Kitteridge for his development of Tethys, and for providing assistance in using the platform and accessing data.
The New Zealand Geotechnical Database for providing us with groundwater level data.
Armandine Bosserelle for providing us with groundwater level data for the Christchurch area.
Karen Grant & Nektaria Papadopoulos from Tauranga City Council.
This work was made possible by Future Coasts Aotearoa (FCA) Funding from the Ministry of Business Innovation and Employment (MBIE), managed by the National Institute of Water and Atmospheric Research (NIWA), contract C01X2107. We would like to acknowledge the support of the programme, NIWA, and the other researchers involved in the project.
References#
Baddock E, 2019. Water Level Field Measurement Standard Version: 3.0.0. National Environmental Monitoring Standard. Date of Issue: July 2019
GNS Science. (2022). National Groundwater Monitoring Programme (NGMP) [Data set]. GNS Science.
Hills Laboratories. 2024. Hilltop Software [Computer software].
Kittridge M. 2023. Tethys: A Python package for accessing geospatial time series data (Version 4.5.15) [Computer software]. tethys-ts/tethysts
New Zealand Geotechnical Database. (n.d.). Retrieved [3-9-2024], from https://www.nzgd.org.nz/
National Institute of Water and Atmospheric Research (2021). Future Coasts Aotearoa Project Outline. National Institute of Water and Atmospheric Research.
Parliamentary Commissioner for the Environment. 2019. Focusing Aotearoa New Zealand’s environmental reporting system. November 2019. Wellington, New Zealand: Parliamentary
Reinecke R., Wachholz, A., Mehl, S., Foglia, L., Niemann, C., & Döll, P. 2020. Importance of Spatial Resolution in Global Groundwater Modeling. Groundwater, 58(3), 363–376. https://doi.org/10.1111/gwat.12996
World Meteorological Organization. 2023. State of Global Water Resources report 2022 (WMO-No. 1333). WMO.
Supplementary Material#
The following tables and figures are supplementary material for the paper and are included here to provide additional, readily accessible information about the dataset.
Cumulative records and sites per source#
The following figures show the cumulative number of records and sites over time per data source.
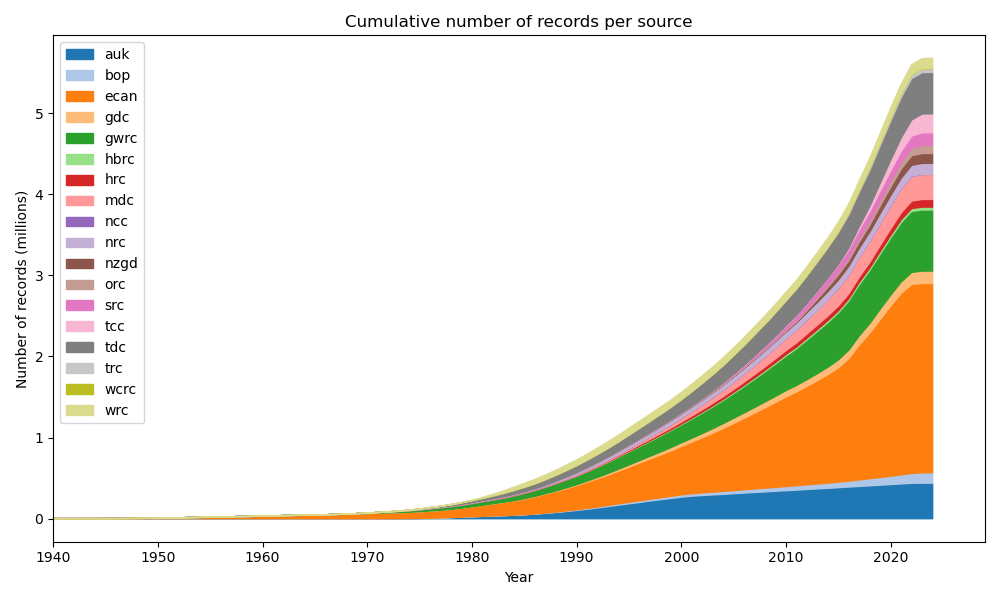
The growth in the number of records by source over time.#
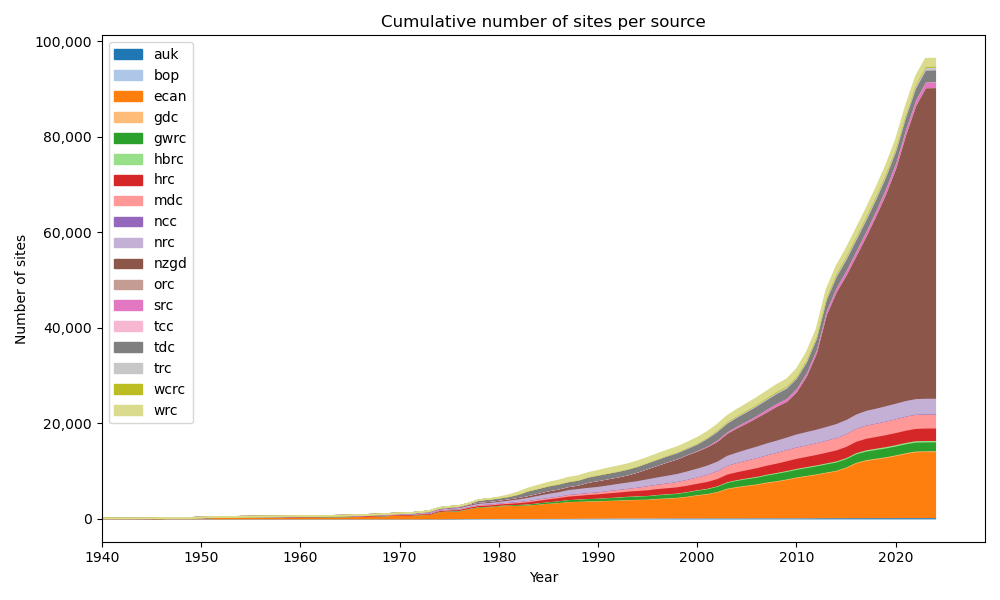
The growth in the number of sites by source over time.#
Summary of variance and skewness of depth to water#
The following tables summarize the variance and skewness of the depth to water measurements (across time) for all sites in given depth categories.
Table 4 Summary of variance and skewness for well depth < 10m or unknown depth and max dtw < 10m
Summary of variance and skewness for 10m <= well depth < 30m or unknown depth and max 10m <= dtw < 30m
Mean DTW Bin |
Std median (m) |
Std range (m) |
Skew median (m) |
Skew range (m) |
Kurt. median (m) |
Kurt. range |
N obs. |
N sites |
|---|---|---|---|---|---|---|---|---|
<0.1 m |
0.09 |
0.02 - 0.28 |
-0.13 |
-1.02 - 0.84 |
0.82 |
-1.47 - 3.70 |
2,253 |
7 |
0.1 m to 0.5 m |
0.24 |
0.17 - 0.49 |
0.31 |
-1.78 - 1.73 |
-0.05 |
-0.95 - 8.27 |
1,133 |
9 |
0.5 m to 1 m |
0.27 |
0.09 - 1.40 |
0.07 |
-1.22 - 13.79 |
0.29 |
-1.53 - 394.80 |
36,542 |
35 |
1 m to 1.5 m |
0.37 |
0.07 - 1.17 |
0.32 |
-1.96 - 4.24 |
0.09 |
-1.14 - 24.01 |
46,232 |
53 |
1.5 m to 2 m |
0.37 |
0.14 - 2.78 |
0.37 |
-1.64 - 12.84 |
1.56 |
-1.24 - 445.51 |
47,132 |
51 |
2 m to 3 m |
0.40 |
0.08 - 2.6 |
0.07 |
-2.89 - 4.22 |
0.69 |
-1.28 - 24.53 |
112,205 |
113 |
3 m to 5 m |
0.77 |
0.14 - 3.41 |
0.12 |
-2.28 - 8.33 |
0.25 |
-1.36 - 71.77 |
247,927 |
207 |
5 m to 10 m |
1.02 |
0.17 - 4.50 |
-0.06 |
-4.28 - 3.71 |
0.22 |
-1.47 - 60.09 |
307,509 |
411 |
10 m to 15 m |
0.93 |
0.18 - 4.59 |
-0.17 |
-7.67 - 4.77 |
0.08 |
1.47 - 175.60 |
246,065 |
254 |
15 m to 20 m |
1.12 |
0.24 - 5.31 |
-0.45 |
-6.07 - 3.00 |
0.21 |
-1.37 - 66.69 |
176,344 |
118 |
20 m to 30 m |
0.81 |
0.15 - 3.71 |
-0.21 |
10.77 - 1.92 |
0.88 |
-1.24 - 229.04 |
69,924 |
61 |
Summary of variance and skewness for deep wells (>=30m)
Mean DTW Bin |
Std median (m) |
Std range (m) |
Skew median (m) |
Skew range (m) |
Kurt. median (m) |
Kurt. range |
N obs. |
N sites |
|---|---|---|---|---|---|---|---|---|
<0.1 m |
0.16 |
0.08 - 0.45 |
0.09 |
-5.79 - 3.38 |
0.22 |
-0.96 - 33.02 |
532 |
9 |
0.1 m to 0.5 m |
0.28 |
0.20 - 0.69 |
2.33 |
0.16 - 52.2 |
4.80 |
-1.02 - 3718.59 |
7,229 |
8 |
0.5 m to 1 m |
0.34 |
0.06 - 1.22 |
0.02 |
-1.11 - 3.05 |
-0.18 |
-1 - 11.58 |
5,728 |
10 |
1 m to 1.5 m |
0.51 |
0.13 - 2.95 |
0.59 |
-1.90 - 15.67 |
-0.04 |
-1.23 - 291.23 |
45,987 |
40 |
1.5 m to 2 m |
0.60 |
0.09 - 1.44 |
0.65 |
-0.74 - 3.27 |
0.24 |
-1.03 - 14.99 |
88,291 |
28 |
2 m to 3 m |
0.67 |
0.08 - 2.44 |
0.45 |
-3.08 - 17.44 |
0.64 |
-1.49 - 620.59 |
145,570 |
72 |
3 m to 5 m |
0.84 |
0.14 - 4.42 |
0.61 |
-2.74 - 8.64 |
0.44 |
-1.29 - 79.17 |
141,289 |
139 |
5 m to 10 m |
1.15 |
0.16 - 6.9. |
0.59 |
-3.87 - 8.25 |
0.29 |
-1.32 - 77.49 |
191,908 |
237 |
10 m to 15 m |
1.78 |
0.10 - 13.03 |
0.52 |
-1.75 - 6.41 |
0.21 |
-1.71 - 43.14 |
122,736 |
172 |
15 m to 20 m |
2.04 |
0.09 - 14.37 |
0.26 |
-4.37 - 10.79 |
0.17 |
-1.51 - 133.02 |
116,993 |
125 |
20 m to 30 m |
1.90 |
0.17 - 16.16 |
0.09 |
-5.47 - 4.66 |
0.16 |
-1.55 - 130.09 |
212,539 |
237 |
30 m to 50 m |
1.79 |
0.14 - 11.79 |
-0.03 |
-42.38 - 5.58 |
0.27 |
-1.8 - 2546.24 |
301,687 |
302 |
50 m to 75 m |
3.03 |
0.14 - 11.16 |
0.03 |
-47.79 - 5.21 |
-0.02 |
-1.6 - 2617.44 |
184,962 |
170 |
75 m to 100 m |
4.37 |
0.14 - 10.43 |
-0.54 |
-59.61 - 3.5 |
1.25 |
-1.63 - 3980.01 |
99,578 |
105 |
>100 m |
1.29 |
0.12 - 14.68 |
-0.20 |
-52.65 - 1.73 |
-0.06 |
-1.61 - 2785.34 |
115,829 |
104 |
Frequency and probability of shallow depth to water#
The following tables summarize the frequency and probability of shallow depth to water measurements (across time) for all sites in given depth categories.
Annual Frequency and Probability of Depth to Water <0.1m
Mean DTW Bin |
Mean n days DTW < 0.1 |
Std n days DTW < 0.1 |
Min n days DTW < 0.1 |
Max n days DTW < 0.1 |
Mean probability (<0.1m) |
Std probability (<0.1m) |
|---|---|---|---|---|---|---|
<0.1m |
340.77 |
36.15 |
223.31 |
365.00 |
0.93 |
0.10 |
0.1m to 0.5m |
72.00 |
91.63 |
0.00 |
359.55 |
0.20 |
0.25 |
0.5m to 1m |
7.12 |
23.41 |
0.00 |
364.65 |
0.02 |
0.06 |
1m to 1.5m |
2.92 |
15.21 |
0.00 |
331.28 |
0.01 |
0.04 |
1.5m to 2m |
1.40 |
5.33 |
0.00 |
58.95 |
0.00 |
0.01 |
2m to 3m |
1.16 |
4.12 |
0.00 |
65.28 |
0.00 |
0.01 |
3m to 5m |
1.06 |
4.31 |
0.00 |
71.28 |
0.00 |
0.01 |
5m to 10m |
0.82 |
3.08 |
0.00 |
39.22 |
0.00 |
0.01 |
10m to 15m |
0.80 |
4.08 |
0.00 |
65.34 |
0.00 |
0.01 |
15m to 20m |
2.44 |
22.92 |
0.00 |
337.64 |
0.01 |
0.06 |
20m to 30m |
0.61 |
4.66 |
0.00 |
73.74 |
0.00 |
0.01 |
30m to 50m |
0.74 |
4.79 |
0.00 |
60.59 |
0.00 |
0.01 |
50m to 75m |
0.78 |
4.79 |
0.00 |
53.10 |
0.00 |
0.01 |
75m to 100m |
0.27 |
1.47 |
0.00 |
11.61 |
0.00 |
0.00 |
>100m |
0.24 |
1.22 |
0.00 |
9.99 |
0.00 |
0.00 |
Annual Frequency and Probability of Depth to Water <0.5m
Mean DTW Bin |
Mean n days DTW < 0.5 |
Std n days DTW < 0.5 |
Min n days DTW < 0.5 |
Max n days DTW < 0.5 |
Mean probability (<0.5m) |
Std probability (<0.5m) |
|---|---|---|---|---|---|---|
<0.1m |
361.02 |
10.46 |
314.03 |
365.00 |
0.99 |
0.03 |
0.1m to 0.5m |
291.12 |
58.87 |
158.44 |
365.00 |
0.80 |
0.16 |
0.5m to 1m |
53.28 |
60.23 |
0.00 |
364.79 |
0.15 |
0.17 |
1m to 1.5m |
9.93 |
23.24 |
0.00 |
337.95 |
0.03 |
0.06 |
1.5m to 2m |
3.57 |
10.03 |
0.00 |
87.51 |
0.01 |
0.03 |
2m to 3m |
2.17 |
6.45 |
0.00 |
67.24 |
0.01 |
0.02 |
3m to 5m |
1.52 |
5.28 |
0.00 |
79.14 |
0.00 |
0.01 |
5m to 10m |
0.95 |
3.40 |
0.00 |
40.87 |
0.00 |
0.01 |
10m to 15m |
0.85 |
4.20 |
0.00 |
65.90 |
0.00 |
0.01 |
15m to 20m |
2.51 |
23.46 |
0.00 |
346.02 |
0.01 |
0.06 |
20m to 30m |
0.63 |
4.69 |
0.00 |
74.07 |
0.00 |
0.01 |
30m to 50m |
0.75 |
4.81 |
0.00 |
60.77 |
0.00 |
0.01 |
50m to 75m |
0.78 |
4.80 |
0.00 |
53.19 |
0.00 |
0.01 |
75m to 100m |
0.27 |
1.47 |
0.00 |
11.66 |
0.00 |
0.00 |
>100m |
0.24 |
1.23 |
0.00 |
10.01 |
0.00 |
0.00 |
Annual Frequency and Probability of Depth to Water <1m
Mean DTW Bin |
Mean n days DTW < 1 |
Std n days DTW < 1 |
Min n days DTW < 1 |
Max n days DTW < 1 |
Mean probability (<1m) |
Std probability (<1m) |
|---|---|---|---|---|---|---|
<0.1m |
363.01 |
7.35 |
319.73 |
365.00 |
0.99 |
0.02 |
0.1m to 0.5m |
357.17 |
11.74 |
313.57 |
365.00 |
0.98 |
0.03 |
0.5m to 1m |
299.90 |
56.54 |
122.86 |
365.00 |
0.82 |
0.15 |
1m to 1.5m |
72.71 |
62.27 |
0.00 |
341.51 |
0.20 |
0.17 |
1.5m to 2m |
15.33 |
30.35 |
0.00 |
227.96 |
0.04 |
0.08 |
2m to 3m |
5.61 |
13.33 |
0.00 |
127.89 |
0.02 |
0.04 |
3m to 5m |
2.78 |
8.34 |
0.00 |
89.64 |
0.01 |
0.02 |
5m to 10m |
1.21 |
3.98 |
0.00 |
43.11 |
0.00 |
0.01 |
10m to 15m |
0.93 |
4.37 |
0.00 |
66.62 |
0.00 |
0.01 |
15m to 20m |
2.56 |
23.66 |
0.00 |
348.94 |
0.01 |
0.06 |
20m to 30m |
0.65 |
4.74 |
0.00 |
74.47 |
0.00 |
0.01 |
30m to 50m |
0.76 |
4.84 |
0.00 |
60.99 |
0.00 |
0.01 |
50m to 75m |
0.79 |
4.82 |
0.00 |
53.31 |
0.00 |
0.01 |
75m to 100m |
0.28 |
1.48 |
0.00 |
11.71 |
0.00 |
0.00 |
>100m |
0.24 |
1.23 |
0.00 |
10.04 |
0.00 |
0.00 |
Histograms of depth to water#
The following figures show histograms of the mean depth to water, the standard deviation of depth to water (at each site) and the cumulative probability of depth to water (across time) for all sites in given depth categories.
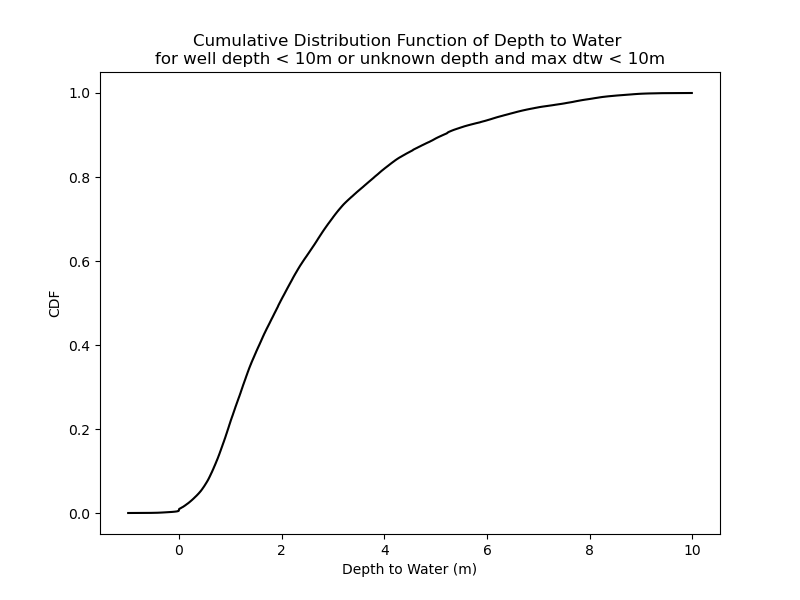
Cumulative probability of depth to water for shallow wells#
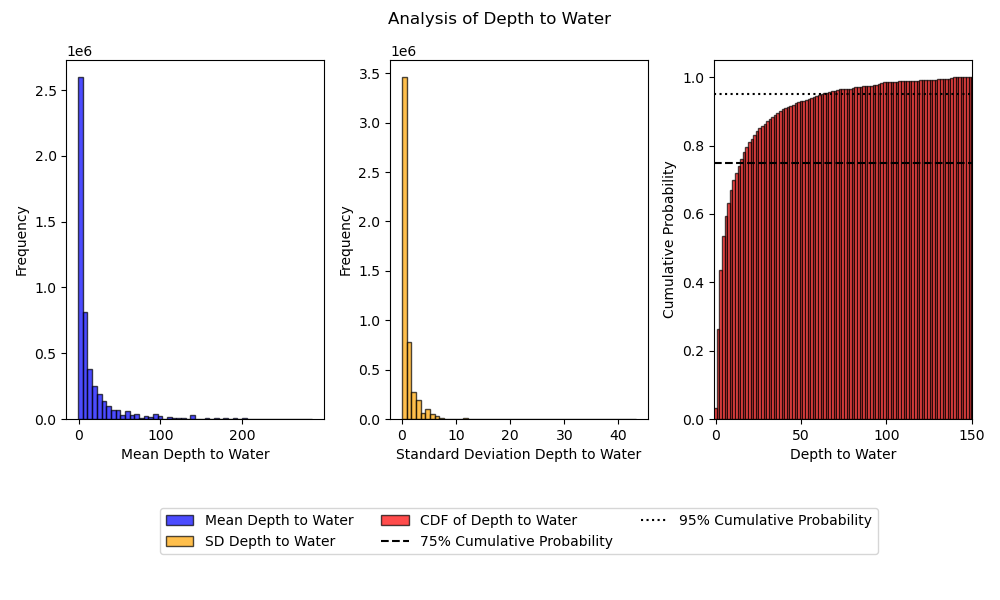
The mean depth to water, histogram of the standard deviation of depth to water and the cumulative probability of depth to water for all sites.#
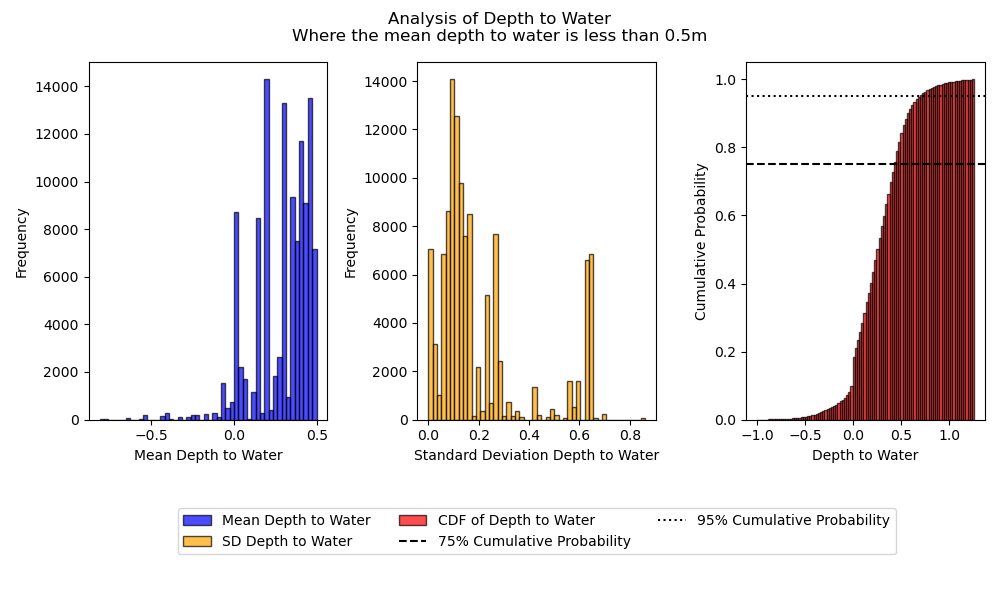
The mean depth to water, histogram of the standard deviation of depth to water and the cumulative probability of depth to water for all sites where the mean depth to water is less than 0.5 m.#
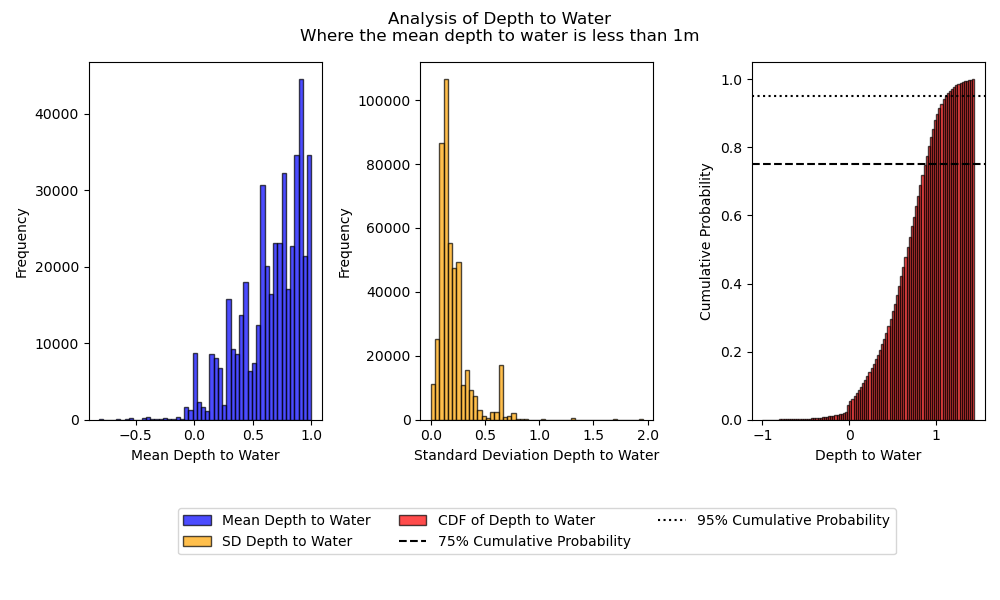
The mean depth to water, histogram of the standard deviation of depth to water and the cumulative probability of depth to water for all sites where the mean depth to water is less than 1 m.#
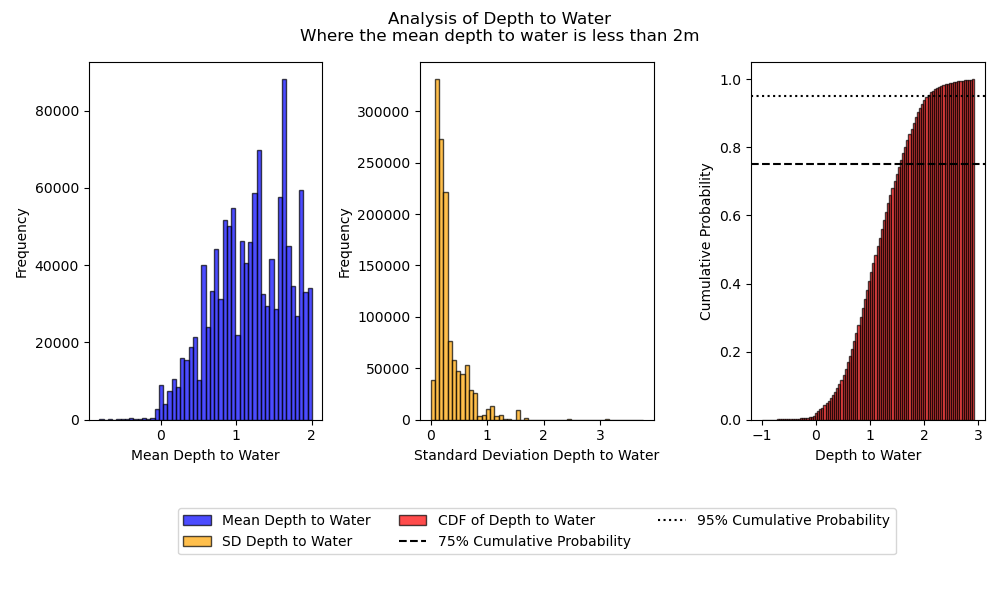
The mean depth to water, histogram of the standard deviation of depth to water and the cumulative probability of depth to water for all sites where the mean depth to water is less than 2 m.#